Data Analytics | Business Analytics | Interactive Power BI Developer
I am an aspiring Data and Business Analyst with a strong interest in transforming complex datasets into clear, actionable insights that support informed decision making.
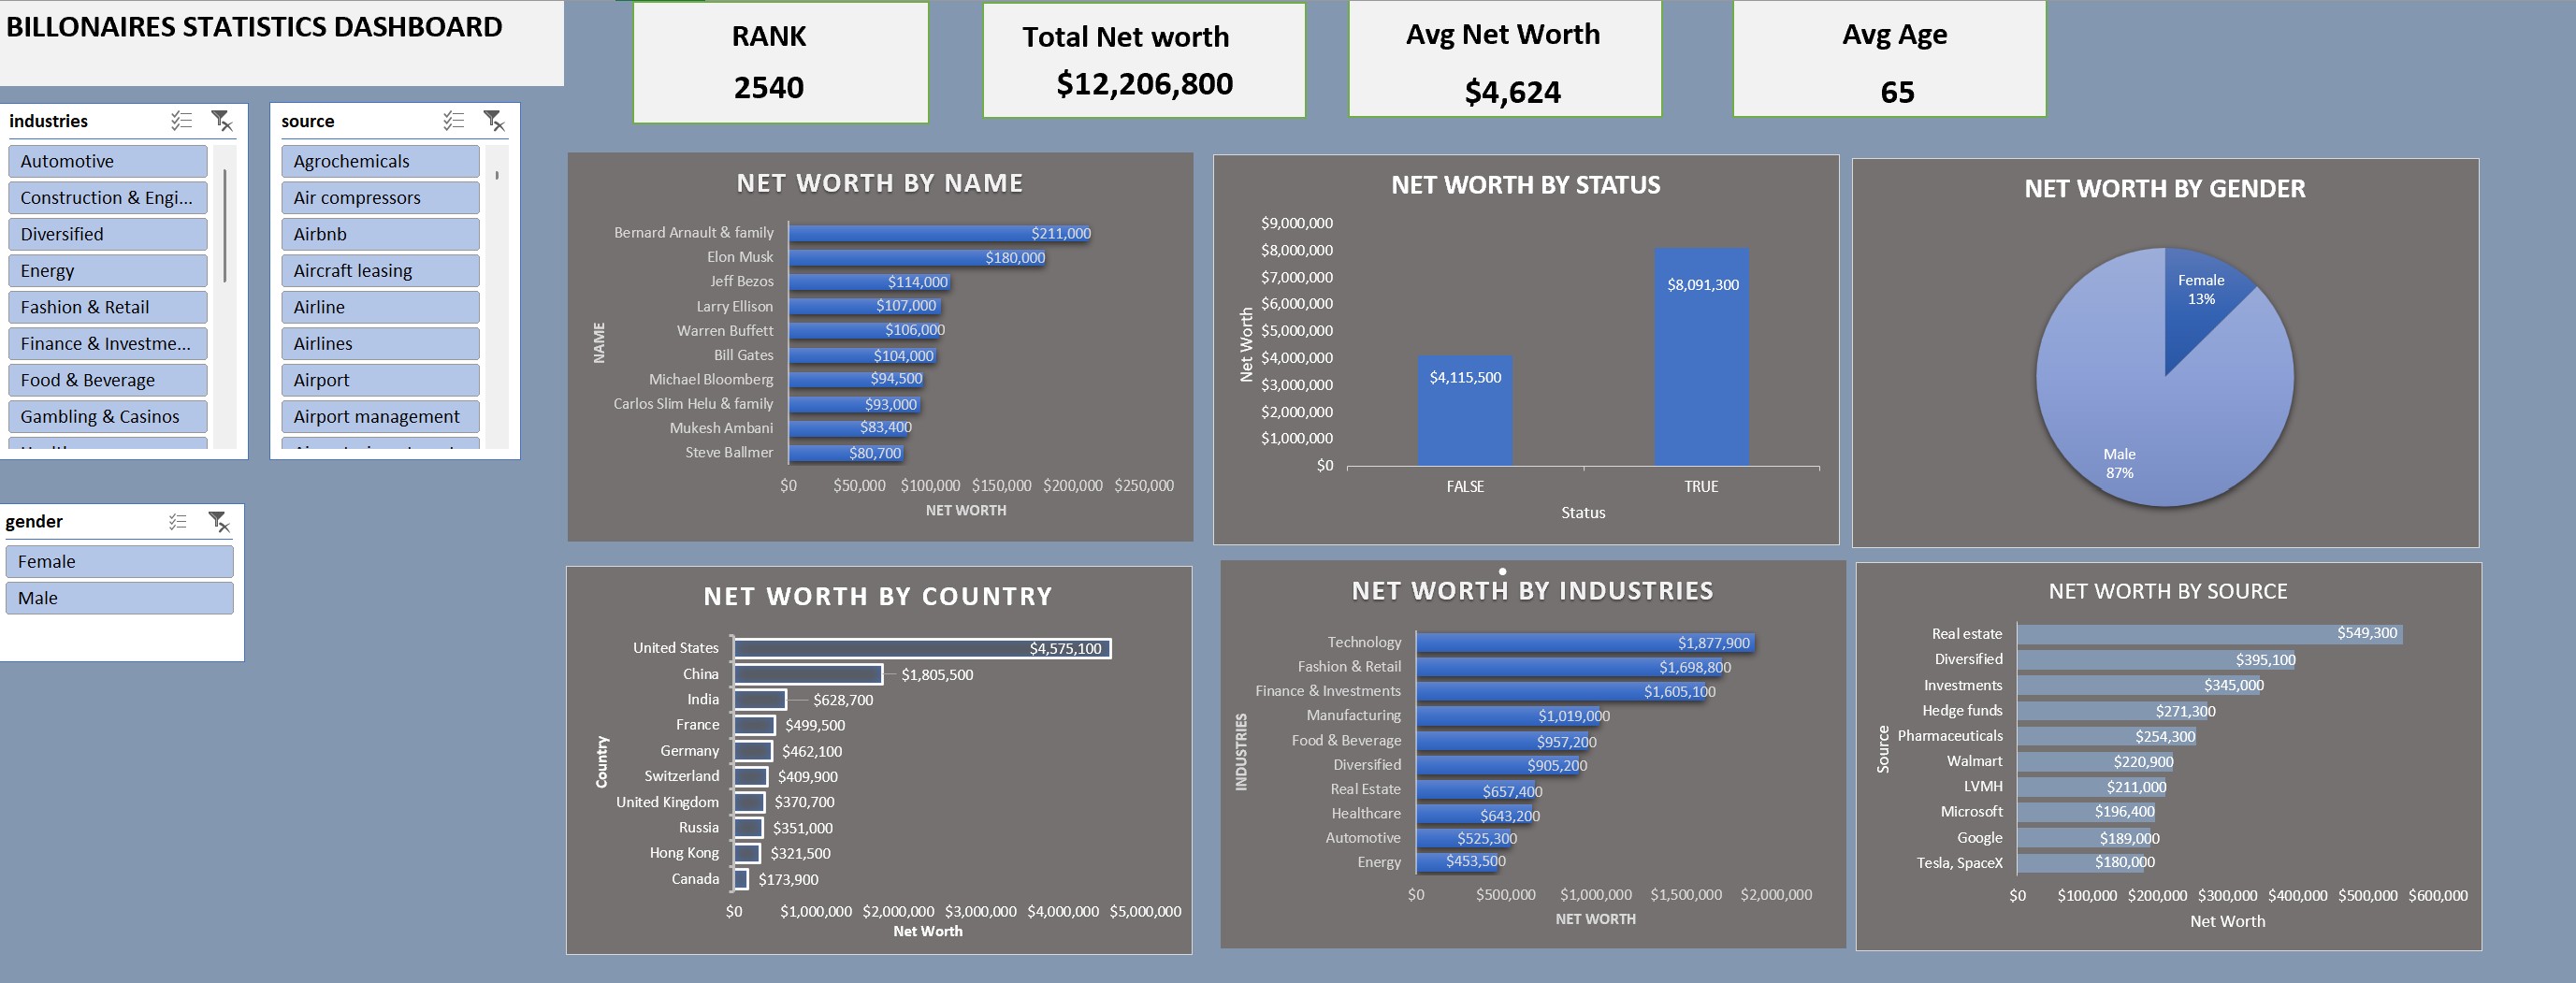
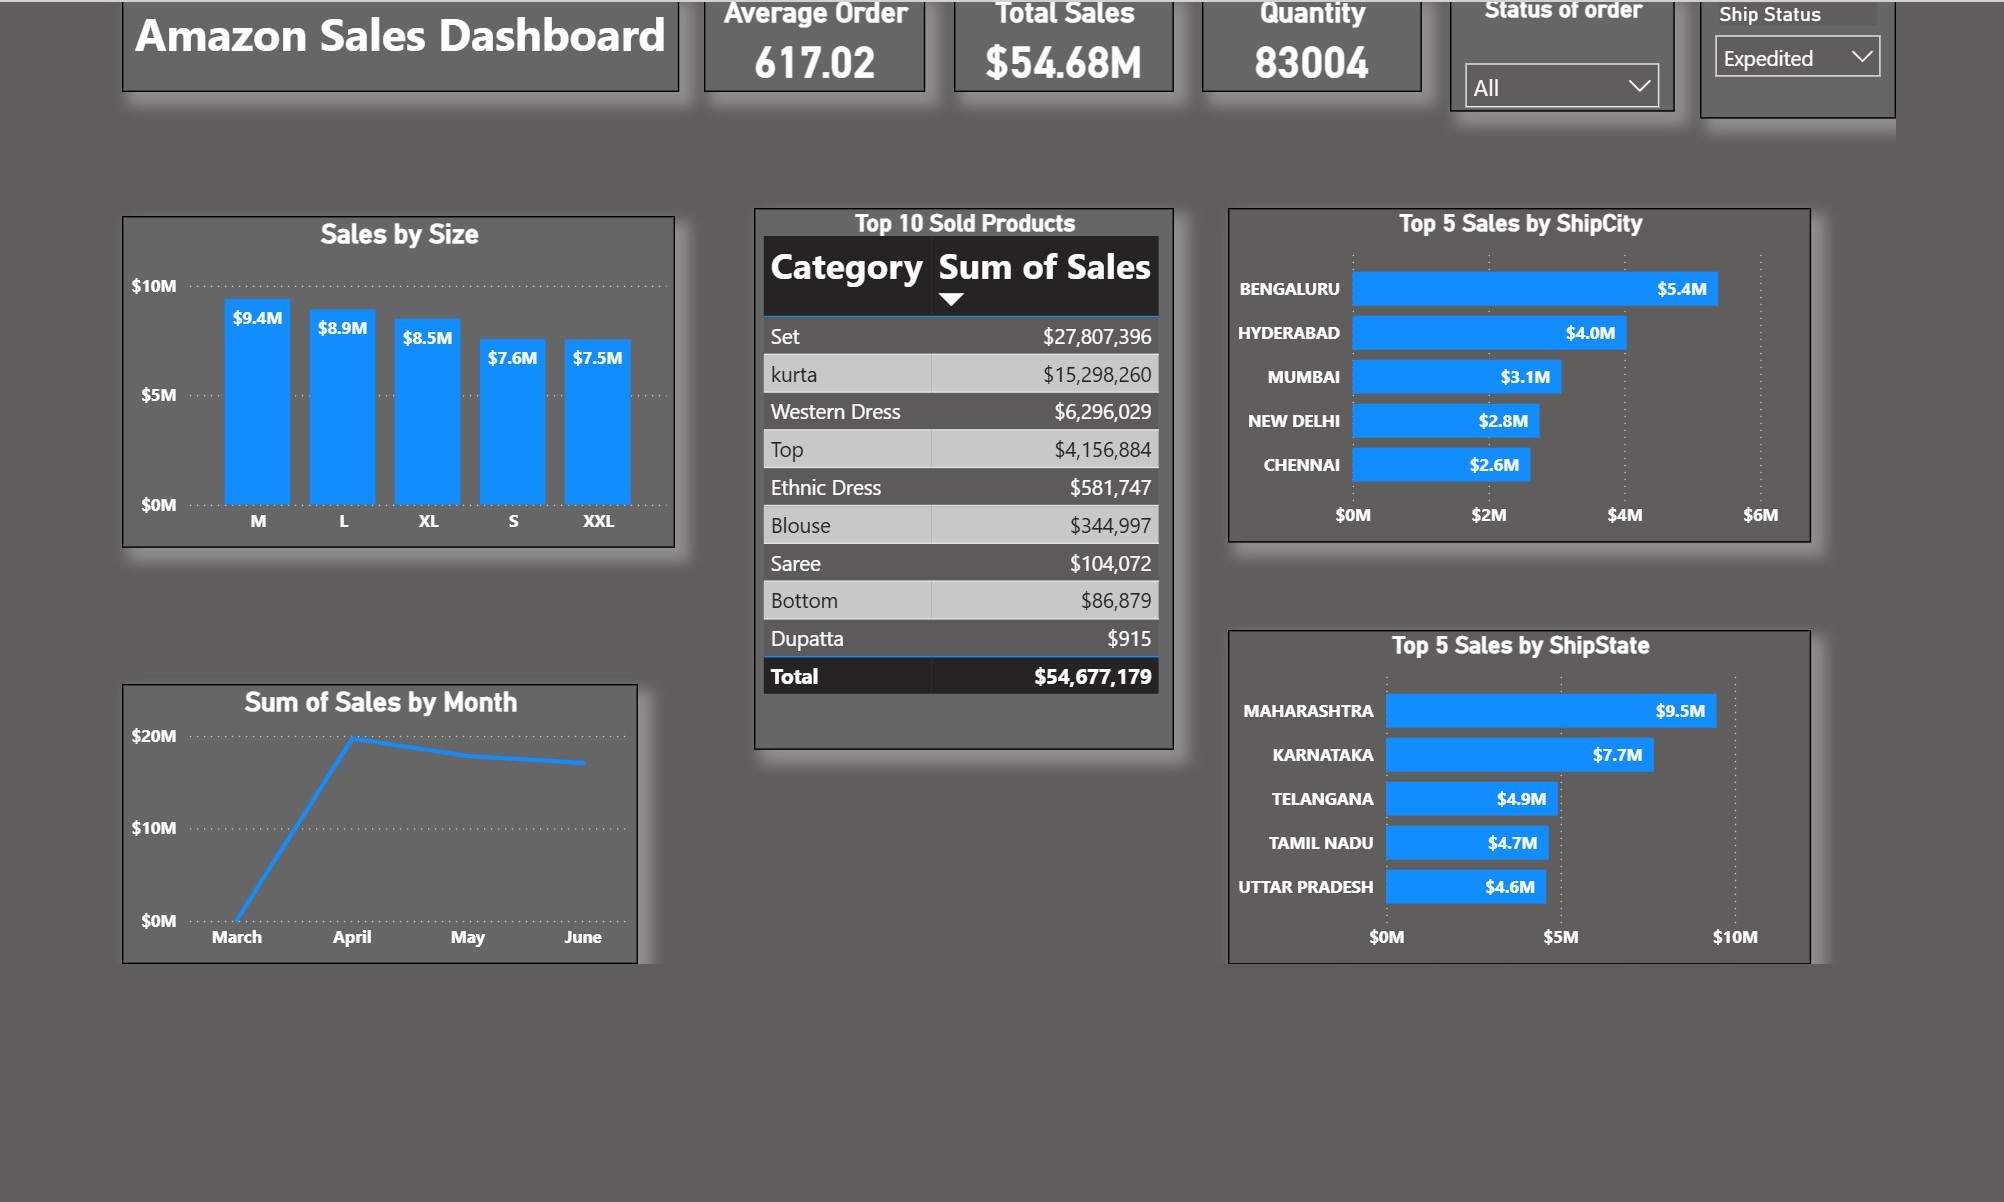
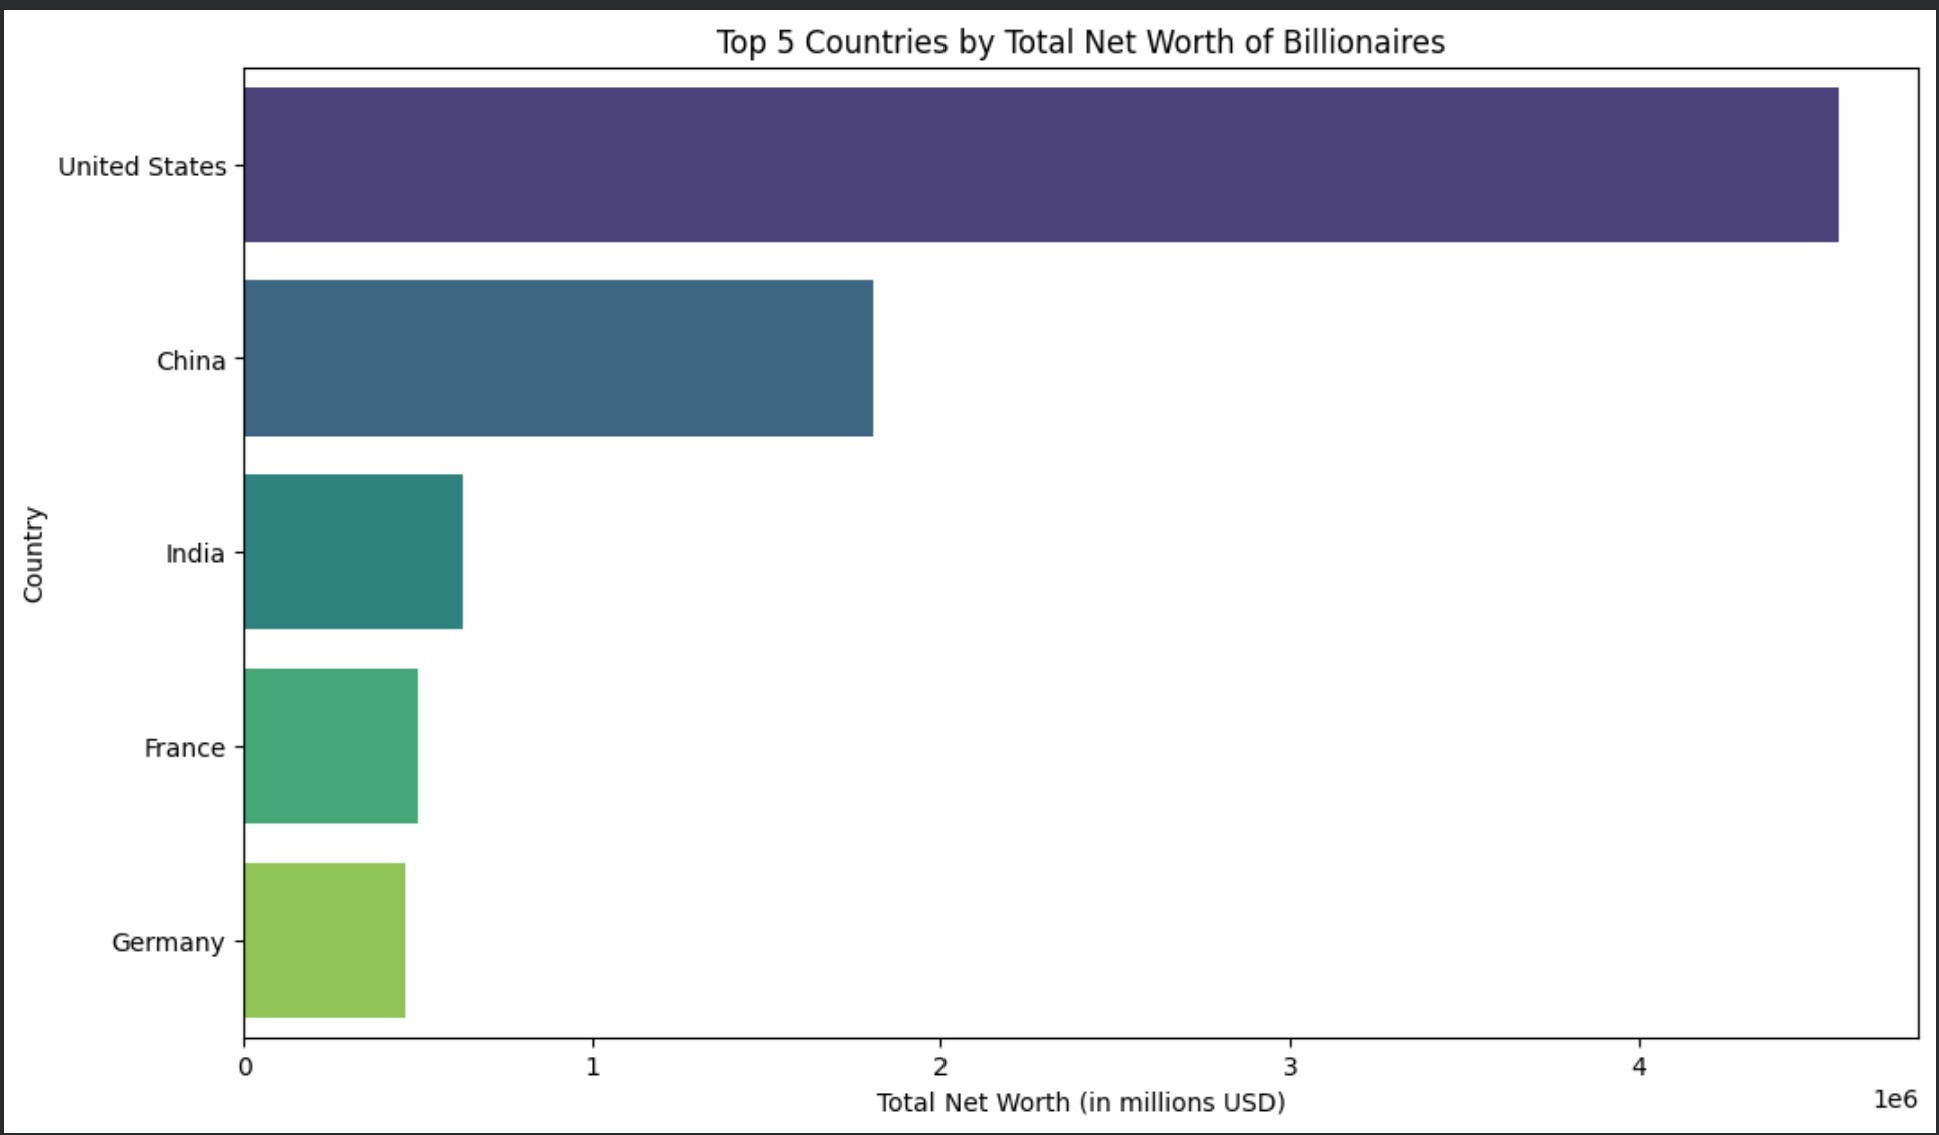
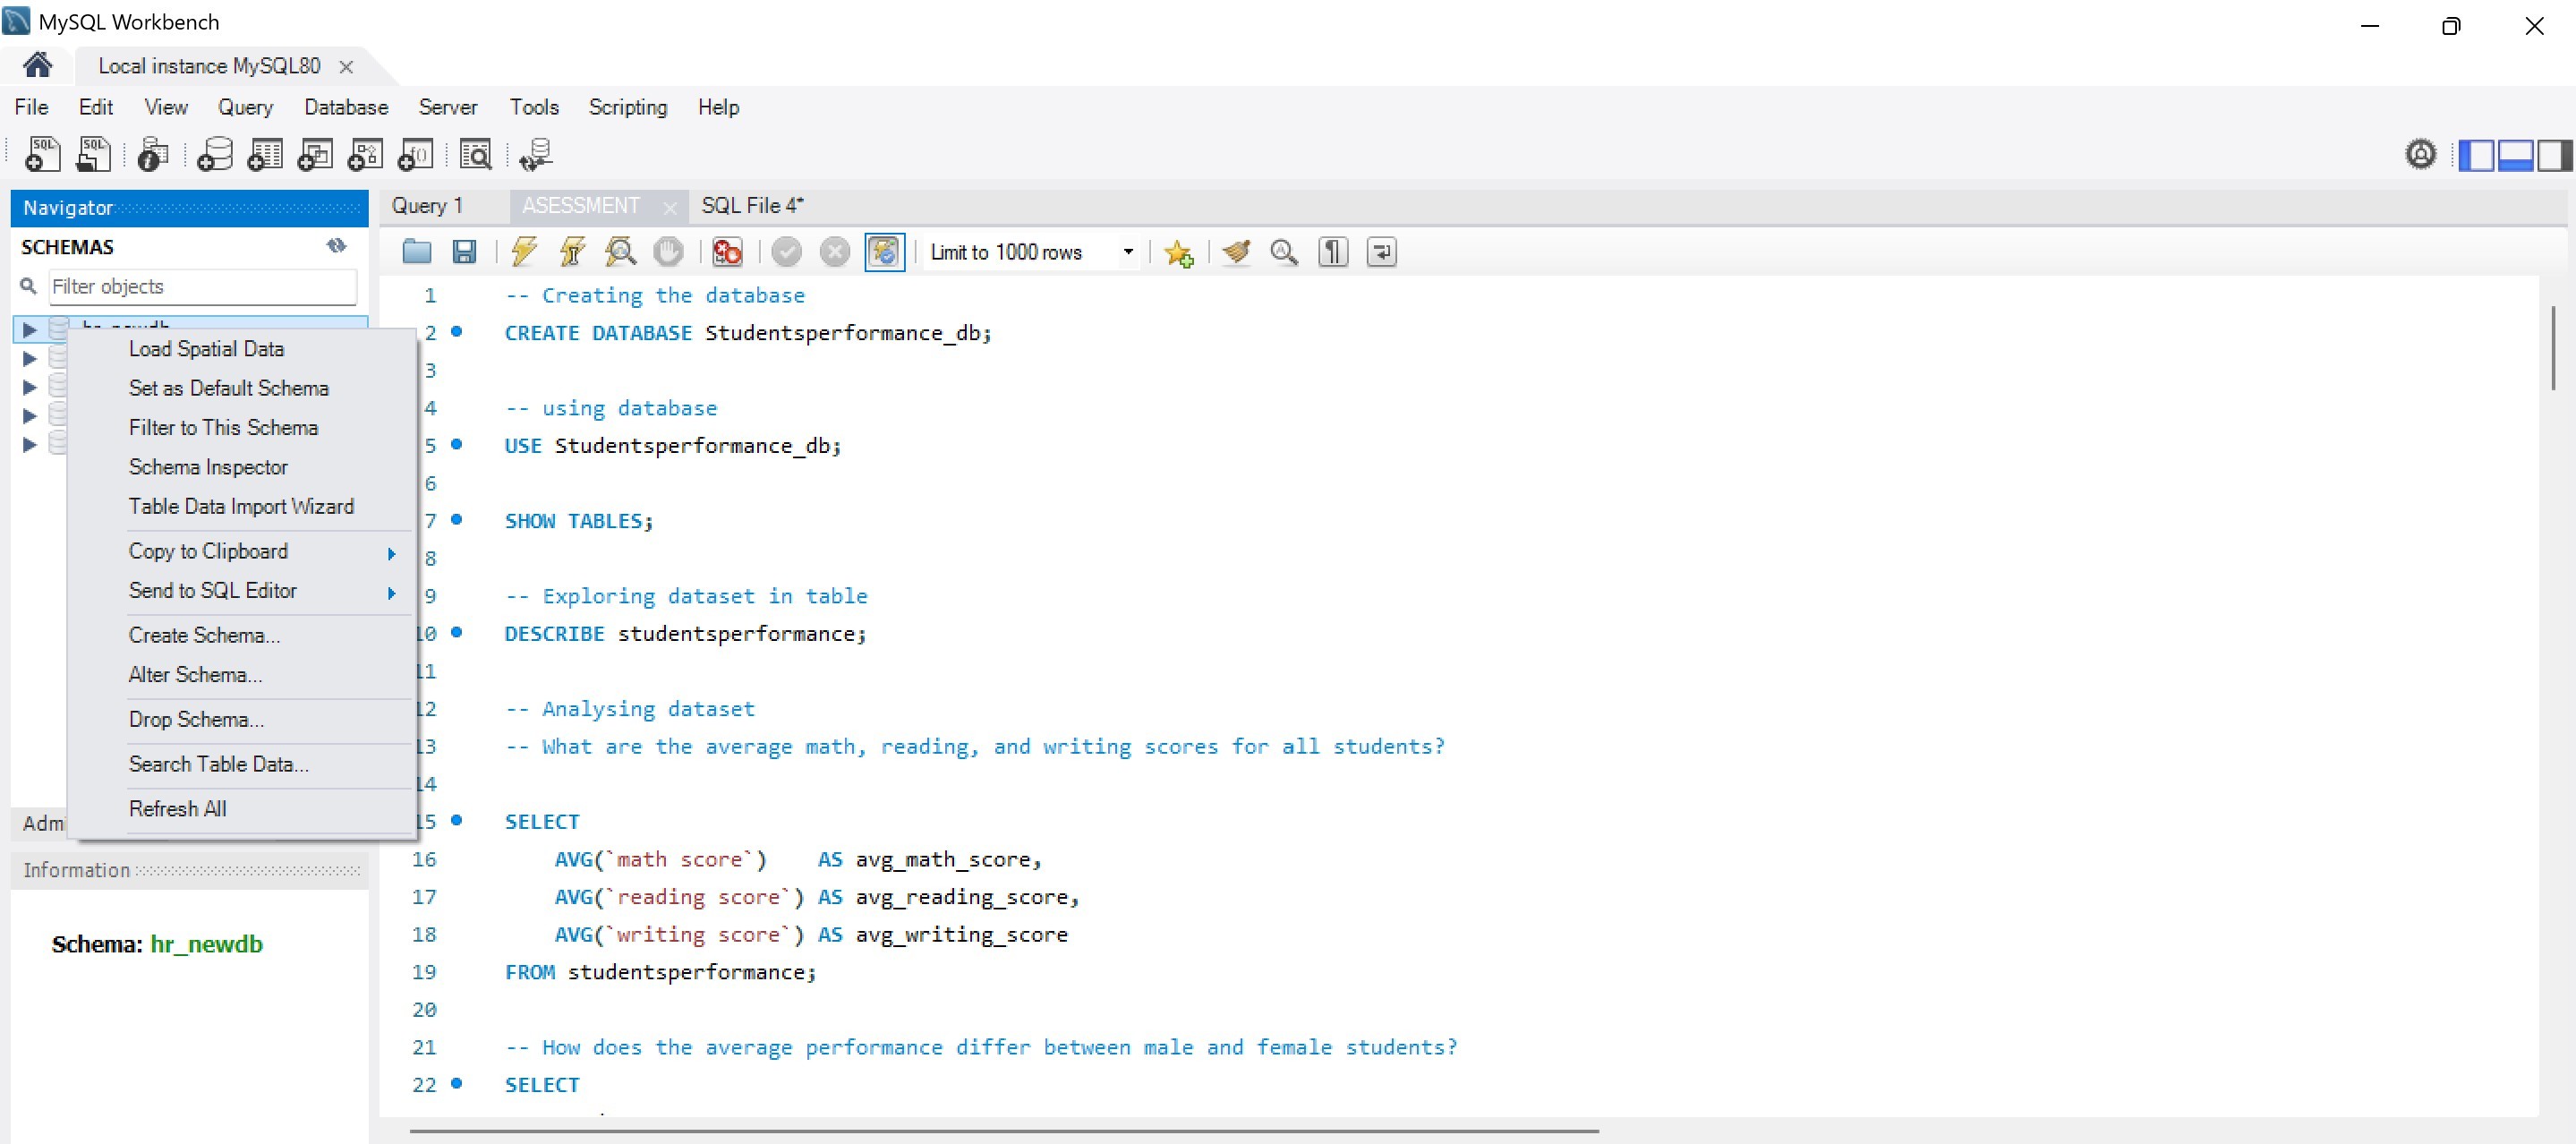
I enjoy working at the intersection of data and business understanding problems, defining KPIs, and building dashboards that help stakeholders track performance and identify trends. I have hands-on experience using *ower BI, SQL, Excel, and Python through personal and learning projects focused on data analysis, reporting, and data visualization.
This portfolio showcases projects I’ve completed while developing my analytical, visualization, and problem-solving skills.
Analyzed global billionaire data to explore wealth distribution across countries, industries, and demographics. Built an interactive Excel dashboard using pivot tables, slicers, and KPIs to communicate key insights, and support high level business understanding of wealth distribution trends..
Analyzed an Amazon sales dataset to track sales performance and key business metrics. Built an interactive Power BI dashboard using data modeling, DAX measures, and visualizations to identify trends and monitor KPIs, and support business decisions related to sales performance and revenue analysis.
Performed exploratory data analysis on a global billionaire dataset using Python in Google Colab. Used pandas and visualization libraries to clean data, analyze distributions, and uncover key patterns.
Analysed a student performance dataset containing 1,000+ records using SQL. Performed descriptive and comparative analysis across math, reading, and writing scores to examine performance patterns and group-level differences..